Please enable JavaScript and refresh your page.
Learn what MATTERS in your state.
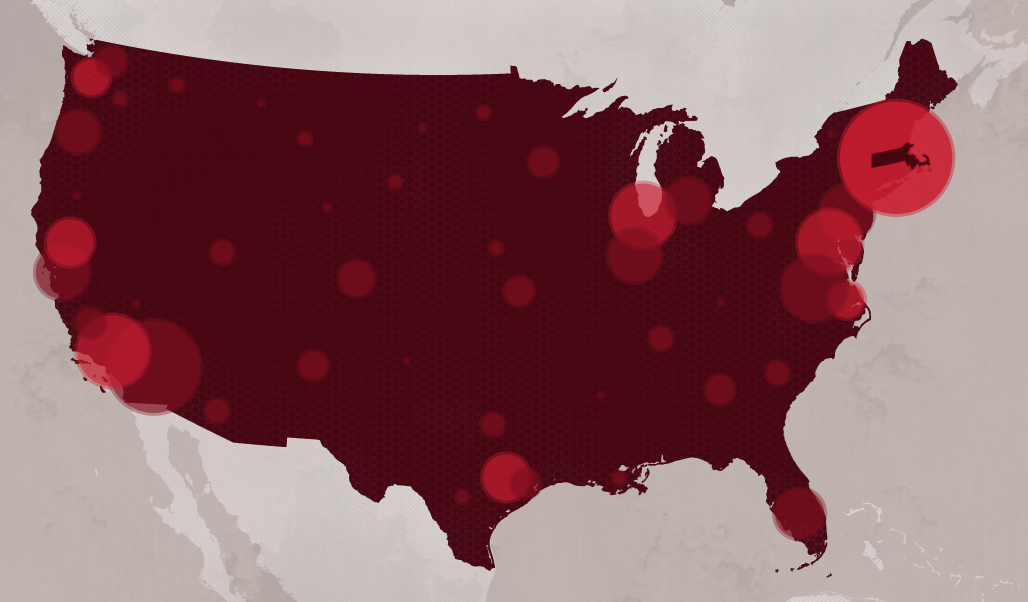
Click on any state to learn more.

"Until MATTERS, enormously valuable data resided in disparate places - and in static form - effectively locked away from those who might leverage it the most to make informed decisions. By aggregating and injecting dynamism into those key data sets, MATTERS will equip policymakers, business leaders, advocates and researchers with a real-time data analytics tool that will help shape our public policy agenda, our debates and the outcomes of key decisions to be made in Massachusetts for years to come."
Gary Beach, Editor Emeritus, CIO Magazine
About
The Massachusetts High Technology Council developed the
Massachusetts Technology, Talent and Economic Reporting System
to advance our mission to make Massachusetts the world's most
attractive place in which to create and grow a high technology
business. MATTERS is designed to measure and evaluate
Massachusetts' current competitive position, while providing
policy makers and advocates with dynamic, searchable data to
inform public policy decisions that help attract and retain
business to the state.
Methodology
MATTERS is not a primary data source, but instead is an
aggregation of published data and analysis from several sources
including federal and state governmental agencies, non-profit
organizations and media outlets. As a tool for comparison
between states, the MATTERS data library only houses datasets
that span all 50 states and contain state-by-state data. As
such, a user can select any combination of states, metrics, and
time periods they would like to view. You can view the entire
library of MATTERs data by selecting the "Explore the Data"
option above.
How to Use MATTERS
The MATTERS overview map highlights the 15 states that make up
the MATTERS peer technology states. Users can see a state's
specific index ranking by clicking on the state, and can access
the full state profile by selecting "Learn More" in the display
window. The data explorer permits users to customize their
experience and retrieve data on one or more metrics from one or
more states and across multiple years simultaneously. Data can
be displayed in a variety of visualizations including tables,
line charts, bar charts, and heatmaps.


